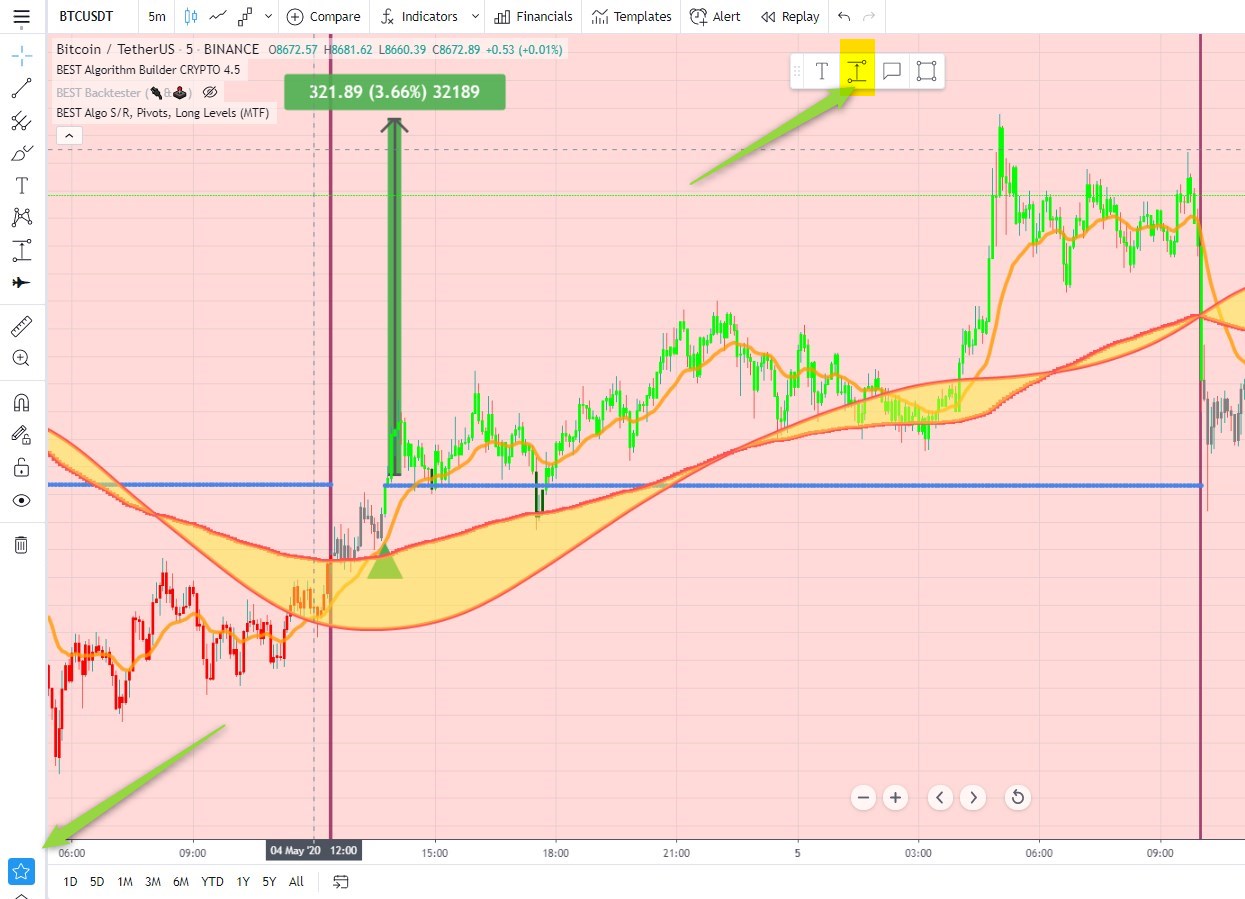
Price range widget
The widget is available on the left-hand toolbar
This tool allows the user to place points vertically on two different prices. A shaded box will then appear showing the range of the prices. Text will also appear along the box displaying the total size of the price move in terms of actual share price as well as percentage
Options
Once you did set your TradingView Price range, you can change the color, label size
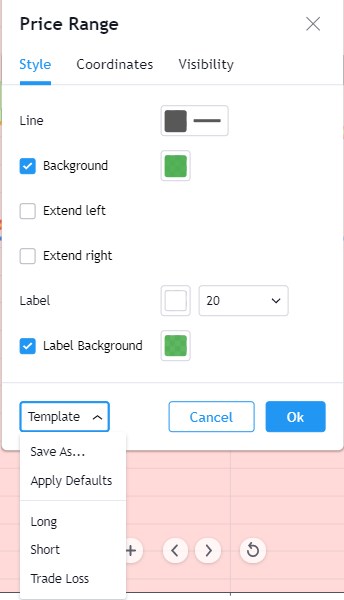
You can even save templates for each TradingView widget which will save a configuration including color, label size, etc.
I did three templates for that one as per my screenshow above:
- Green for a profitable Long trade
- Red for a profitable Short trade
- Orange for a non-profitable trade
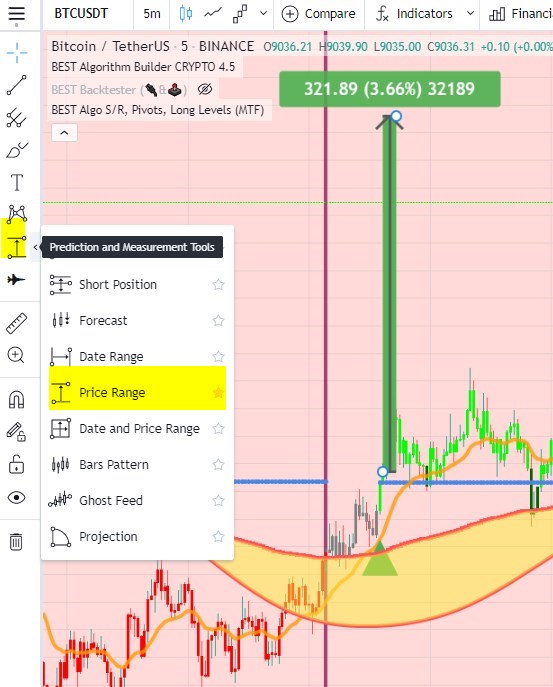
TradingView Favorite tool
I clicked on the star near this widget (as per my image just above), making it available in my favorite toolbar
Then, when I click on the favorite option (star icon at the bottom left), I'll get this price range widget available more easily